

The ASX 200 Today closed modestly higher, with the index clawing back losses as commodity-linked stocks and select cyclicals rebounded. Beneath the surface, sector rotation remained active, with materials and tech providing support while parts of financials and defensive stocks lagged.
Amid recent double-digit corrections, volatile commodity prices, and uncertain global growth signals, the move appears more like market stabilisation than a true trend reversal, reminding investors to focus on sector drivers and fundamentals rather than short-term market noise.
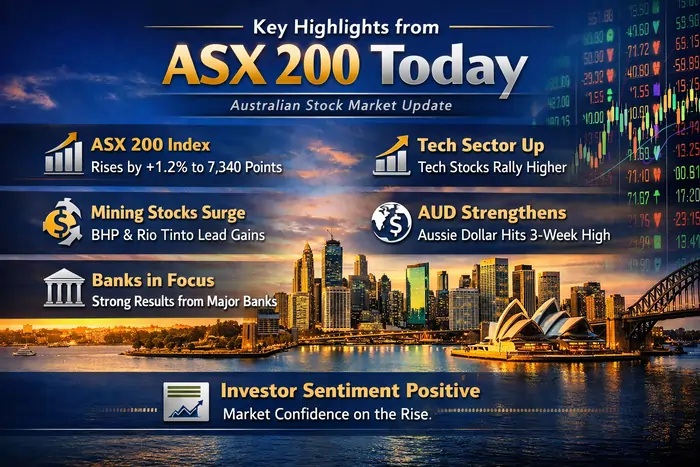
The ASX 200 finished slightly higher today, with modest gains masking a still‑fragile backdrop after a choppy month for Australian equities. For traders and long‑term investors watching the ASX 200 Today, the session highlighted seven key themes: an index rebound after recent losses, sector rotation under the surface, mixed commodity drivers, stock‑specific news, and lingering macro uncertainty.
1. ASX 200 Today: Headline Performance and Context
The benchmark S&P/ASX 200 index edged higher to around the mid‑8400s–8500s region, posting a gain of roughly 0.2 percent after yesterday’s decline. According to Trading Economics, Australia’s main stock market index “rose to 8,478 points on March 31, 2026, gaining 0.20 percent from the previous session,” even though it remains down almost 8 percent over the past month.
Live data providers such as Morningstar and Market Index report the ASX 200 Today trading close to 8,480 points, with only a small intraday move but noticeable dispersion across sectors and stocks. This modest bounce comes after a string of down days that saw the index slide from record highs above 9,200 in late February to recent lows near 8,260.
If you want a real‑time snapshot of the ASX 200 Today, including day high/low and 1‑year return metrics, Market Index and Morningstar’s XJO pages are reliable reference points.
2. Recent Sell‑Off and Technical Backdrop
To understand the ASX 200 Today, it’s essential to look at the correction that came before. IG’s mid‑March reports note that at one stage the index had fallen more than 10 percent from its late‑February record high, hitting a low around 8,262 points. That drop coincided with risk‑off sentiment globally, driven by geopolitical tensions and renewed concerns about the domestic growth outlook.
Technical commentary from IG emphasised that the ASX 200 showed “signs of capitulation” at the recent lows, followed by stabilisation as US markets staged relief rallies and commodity prices bounced. Today’s modest gain in the ASX 200 Today fits into that narrative of a tentative recovery rather than a decisive new uptrend.
For traders who use levels, the 8,250–8,300 zone has acted as short‑term support after the pullback, with resistance now seen closer to the 8,550–8,600 area. Historical data pages at Yahoo Finance or Investing.com can help you contextualise the current session against the recent range.
3. Sector Moves: Where the Action Was
Beneath the flat‑to‑modest‑green headline for the ASX 200 Today, sector rotation remains a defining feature. Over the past few weeks:
- Materials have swung sharply with iron ore and base‑metal prices, suffering a heavy drawdown from early‑March highs before staging rebounds on days when commodity prices recover.
- Financials have mirrored interest‑rate expectations, with big banks bouncing on signs of stable yields but lagging when recession fears flare.
- Technology and health care have acted as “beta levers”, outperforming on risk‑on days and underperforming when markets de‑risk.
Motley Fool’s sector breakdown shows that financials (about 28 percent) and materials (about 23 percent) together account for roughly half the index weight, making their daily moves critical for the ASX 200 Today. Market Index’s ASX sectors guide is a handy reference if you want to see the 11 GICS sectors and their role in the broader market.
On recent up days, IG’s afternoon reports have highlighted strong rebounds in iron ore names like BHP, Rio Tinto, and Fortescue, as well as property names benefiting from shifts in rate expectations. On down days, logistics, producer manufacturing, financials, and health care have led declines, as Trading Economics noted when the ASX 200 recorded a third straight drop earlier this week.
4. Macro Drivers: Rates, Commodities and Global Cues
Today’s session for the ASX 200 Today can’t be separated from its macro backdrop. Several key drivers stand out:
- Global leads – Overnight moves on Wall Street continue to set the tone. Recent weakness in the S&P 500 and Nasdaq has weighed on sentiment, though intermittent relief rallies have provided breathing room for risk assets.
- Interest‑rate expectations – Shifts in RBA and global central‑bank rhetoric around inflation and growth influence the relative appeal of equities vs. bonds, and within equities, tilt flows between growth and value sectors.
- Commodities – Iron ore, oil, and gold prices remain crucial for the ASX 200 Today given the index’s heavy resources tilt. IG’s reports describe days when a 3 percent bounce in crude or a move in iron ore above 100 dollars a tonne helped the index recover from intraday lows.
For example, The Motley Fool recently flagged oil price jumps and gold moves among “5 things to watch” for the ASX 200, noting that spikes in WTI and Brent could drive outperformance in energy names like Santos and Karoon Energy. Trading Economics summarizes this interplay nicely by tracking the Australia stock market index alongside macro news and commodity updates.
5. Stock‑Specific Highlights
A proper look at the ASX 200 Today also means scanning key movers and corporate headlines. In recent sessions, IG and other outlets have highlighted:
- Resource majors – BHP, Rio Tinto, and Fortescue often dominate turnover; rebounds in their share prices after sharp pullbacks have underpinned index recoveries on commodities‑up days.
- Tech names – Stocks like WiseTech Global, Zip, and DroneShield have seen outsized gains on risk‑on days, leading sector performance when global tech sentiment improves.
- Financial stocks – Big four banks and insurers have swung with rate expectations, ex‑dividend adjustments, and M&A news, such as Magellan’s merger‑related moves noted by IG.
The official ASX “Cash market prices” page shows which names are the day’s best and worst performers, listing percentage moves and volume for all index constituents. For a retail‑friendly roundup of the ASX 200 Today, The Motley Fool’s live feed and commentary provide a helpful summary of top gainers, losers, and notable announcements.
6. How to Read the ASX 200 Today as an Investor
For investors, the key is to treat the ASX 200 Today as one snapshot in a much longer story. Here are a few practical ways to use daily moves without overreacting:
- Anchor in time frames – Use historical data on Yahoo Finance or Investing.com to compare today’s close with 1‑month, 3‑month, and 1‑year levels. This helps you see whether a move is noise or part of a bigger trend.
- Track sectors, not just the index – Given the concentration in financials and materials, understanding sector dynamics via tools like the Market Index ASX 200 Today page and its sectors breakdown is critical.
- Align with your portfolio – Map your holdings to index sectors: if you’re overweight tech and health, today’s sector rotation matters more to you than the headline index change.
- Focus on fundamentals over headlines – Use the daily move as a prompt to revisit company fundamentals, valuation, and long‑term thesis, rather than as a reason to chase short‑term swings.
News hubs like Morningstar’s ASX 200 live data page and Market Index combine index levels, charts, sector weightings, and component lists, making them excellent dashboards for your morning or afternoon check‑in.
7. Broader Market Themes to Watch After Today
Beyond the day’s ticks, the ASX 200 Today sits at the intersection of several medium‑term themes that will shape performance in coming months:
- Valuation vs. earnings risk – After hitting record highs above 9,200 earlier this year, the ASX 200’s pullback has improved valuations somewhat, but earnings revisions and economic data will determine whether the market offers genuine value or a value trap.
- China and commodities – Australia’s index remains heavily exposed to Chinese demand for iron ore and other commodities. Shifts in Chinese growth targets or stimulus could be pivotal for materials and, by extension, the ASX 200 Today.
- Rate‑cut hopes vs. inflation persistence – Markets are constantly repricing when and how fast central banks will cut rates. That tug‑of‑war influences everything from bank margins to property stocks and growth valuations.
- Geopolitical shocks – IG’s recent reports cite geopolitical tensions as a trigger for volatility in oil and global risk assets; such shocks can ripple quickly into Australian equities.
For ongoing coverage, you can follow daily recap pages like The Motley Fool’s ASX 200 Today, Market Index’s ASX 200 dashboard, and Trading Economics’ Australia stock market index feed. Together they offer a rounded view of price action, sector context, and macro drivers.
Conclusion
The ASX 200 Today offers a valuable real‑time snapshot of how global forces, commodity moves, sector rotations, and stock‑specific news are playing out in the Australian equity market on any given session. By looking beyond the headline index move to understand which sectors are driving performance and how macro themes are evolving, investors can make more informed decisions rather than reacting to noise.
At the same time, the stock market is only one part of Australians’ financial landscape, which also includes day‑to‑day money decisions at the checkout and online. For a practical look at another area where rules and costs are shifting fast, it’s worth reading 7 Things to Know About Credit Card Surcharges in Australia (2026), which explains how payment surcharges, regulation, and bank behaviour are changing what consumers pay when they tap their cards.
FAQs About ASX 200 Today
What is the ASX 200?
The S&P/ASX 200 is Australia’s main stock market index, tracking the 200 largest listed companies by market capitalisation.
How did the ASX 200 Today perform?
The index recorded a modest gain (~0.2%), recovering slightly after recent declines.
Where can I see real-time ASX 200 data?
You can track live prices, charts, and components via platforms like Market Index and Morningstar under the XJO ticker.
How volatile has the ASX 200 been recently?
The index has experienced high volatility, falling over 10% from record highs before showing signs of a recent rebound.
Which sectors matter most?
Financials and materials dominate, making up a large portion of the index weight and driving most movements.
What were the main sector themes today?
Materials and cyclicals supported gains, while financials and defensive sectors lagged.
How do global markets affect the ASX 200?
Movements in US and European markets, along with commodity price swings, heavily influence daily performance.
Why are commodities so important?
Australia’s market is resource-heavy, so changes in iron ore, energy, and metals prices directly impact earnings and stock prices.
Where can I see top gainers and losers?
Check the ASX market data pages or financial news platforms for daily movers and performance summaries.
How should investors use daily updates?
Focus on long-term trends, sector exposure, and investment strategy rather than reacting to short-term fluctuations.
What tools show sector breakdowns?
Platforms like Market Index provide sector weightings and performance insights.
Is the market in a correction?
The recent drop qualifies as a market correction, but the outlook depends on earnings, interest rates, and global conditions.
How often should investors check the ASX 200?
Most long-term investors prefer daily or weekly reviews instead of constant monitoring.
Where can I find broader economic context?
Economic platforms link the index to macro trends, forecasts, and global developments.
How does this volatility compare to other shocks?
Market swings reflect how sensitive equities are to macro events, similar to how sudden industry disruptions can reshape entire sectors.