
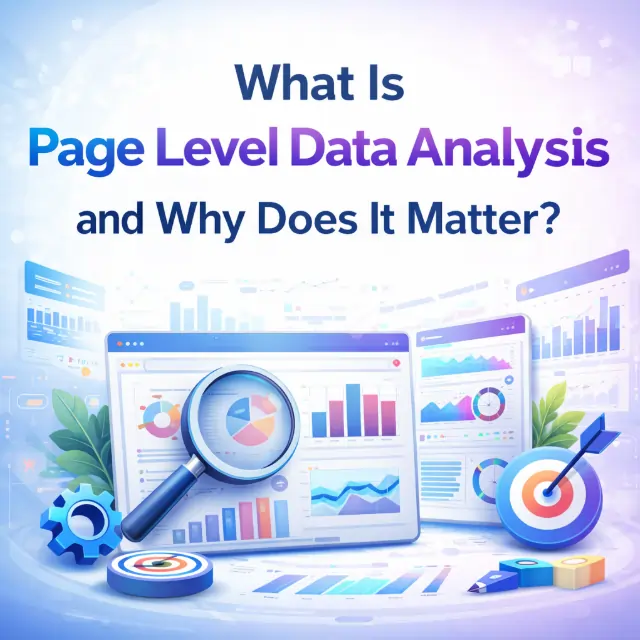
What is page level data analysis? It is the practice of examining individual URL performance rather than site-wide averages. Why does page-level data matter? Because a page converting at 2% and a page at 0.2% look identical in aggregate reports. Page-level analytics reveals exactly which pages are underperforming and why, enabling targeted fixes that improve conversion rates, user experience, and SEO rankings.
Most website owners open Google Analytics, see a bounce rate of 45%, and nod their heads. But what does that number actually tell them? Almost nothing.
A 45% site-wide bounce rate could mean:
- Your homepage bounces at 20% (great)
- Your blog posts bounce at 80% (terrible)
- Your product pages bounce at 35% (average)
Without page level data analysis, you cannot tell the difference. You might “optimize” a page that is already performing well while ignoring the pages that are actively losing you money.
What is page level data analysis? It is the practice of examining individual URL performance metrics — conversion rate, bounce rate, time on page, scroll depth, and technical health — to identify exactly which pages need attention and what specific fixes they require.
This guide will explain why page-level data matters, which metrics to track, how it improves SEO and conversions, and which tools (including Page Datalyzer) can help you implement it effectively.
For a complete overview of page-level analytics tools, read our Page Datalyzer: Complete Guide to Page-Level Analytics.
What Is Page Level Data Analysis?
Page level data analysis is the process of collecting, measuring, and acting on performance data for individual URLs on a website. Unlike traditional analytics that aggregate data across all pages, page-level analysis treats each URL as its own entity.
Key Characteristics of Page Level Data Analysis
| Characteristic | Description |
|---|---|
| URL-specific | Each page has its own performance profile |
| Action-oriented | Tells you what to change on that specific page |
| Comparative | Compare page A vs. page B within the same site |
| Historical | Track how a single page improves over time |
| Diagnostic | Identifies specific elements causing problems |
What Page Level Data Analysis Is NOT
- It is NOT site-wide averages
- It is NOT traffic source analysis (though that can be added)
- It is NOT audience demographics
- It is NOT replacing Google Analytics — it complements it
To see how page-level analysis identifies specific problems, read how Page Datalyzer identifies conversion killers.
Why Site-Wide Averages Lie
Site-wide averages are dangerously misleading. Here is why:
The 80/20 Problem
Most websites follow the Pareto principle: 20% of pages drive 80% of results. But site-wide averages hide this completely.
Example Scenario:
- 90 pages convert at 2% (good)
- 10 pages convert at 0.1% (terrible)
Your site-wide average conversion rate is 1.8%. That looks healthy. But those 10 terrible pages are leaking revenue every single day. Without page-level data, you would never know.
The False Positive Trap
A site-wide metric can look “fine” while hiding major problems:
| Metric | Site-Wide Average | Reality |
|---|---|---|
| Bounce rate | 45% | Blog: 80% / Landing pages: 25% |
| Time on page | 2:30 min | Tutorials: 5 min / Contact page: 0:30 sec |
| Conversion rate | 2% | Product A: 4% / Product B: 0.5% |
The Optimization Mistake
Without page-level data, marketers often optimize the wrong pages. They see a site-wide bounce rate of 45% and try to reduce it everywhere — when the real problem is that 80% bounce rate on blog posts.
The correct approach: Identify the worst-performing pages first. Fix those. Then move to the next tier.
For a deeper comparison of analytics approaches, read Page Datalyzer vs. Google Analytics 4.
The 5 Key Metrics That Matter at Page Level
Not all metrics are equal. Here are the 5 most important page-level metrics:
1. Page-Specific Conversion Rate
The percentage of visitors to that specific URL who complete a desired action (purchase, signup, download).
Why it matters: A page with high traffic but low conversion is leaking revenue. A page with low traffic but high conversion needs more promotion.
2. Page-Specific Exit Rate
The percentage of visitors who leave your site from this specific page.
Why it matters: High exit rate on a product page = problem. High exit rate on a “Thank You” page = normal.
3. Scroll Depth by Page
How far users scroll down each individual page.
Why it matters: If your CTA is at 80% scroll depth but most users stop at 40%, move the CTA up.
4. Time to First Interaction (TTFI)
How long until a user clicks something on the page.
Why it matters: If TTFI exceeds 5 seconds, users are getting distracted or confused.
5. Element-Specific Engagement
Which specific elements (buttons, forms, links) users interact with.
Why it matters: If users click your “Learn More” button but not your “Buy Now” button, the issue is likely price or trust, not interest.
For a step-by-step guide on measuring these metrics, read our step-by-step Page Datalyzer audit tutorial.
How Page Level Data Analysis Improves SEO
Page level data analysis is not just for conversion optimization. It is also critical for SEO.
Core Web Vitals at Page Level
Google’s Core Web Vitals (LCP, FID, CLS) are measured at the page level, not site-wide. A site-wide “pass” could hide individual pages that fail.
Example: Your site-wide LCP is 2.2 seconds (pass). But your product category page has an LCP of 3.5 seconds (fail). Google will rank that specific page lower, even if the rest of your site passes.
Identifying Cannibalization
Page-level analysis reveals when multiple pages target the same keyword. This cannibalization confuses Google and splits your ranking power.
Fix: Consolidate or differentiate the competing pages.
Finding Orphan Pages
Orphan pages are pages with no internal links pointing to them. Google cannot find them easily. Page-level analysis of incoming links reveals orphans instantly.
Tracking Individual Page Rankings
Instead of tracking your domain’s average position, track each page’s ranking for its target keyword. This tells you exactly which pages need SEO attention.
For technical SEO tracking at the page level, see how Page Datalyzer tracks Core Web Vitals and technical SEO.
How Page Level Data Analysis Improves Conversion Rates
This is where page-level analysis delivers the fastest ROI.
The Diagnosis-Before-Fix Rule
Most CRO (conversion rate optimization) efforts fail because they guess instead of diagnose. Page level data analysis provides the diagnosis.
Without page-level data: “I think the button color is the problem. Let’s test red vs. green.”
With page-level data: “Page Datalyzer shows that 40% of users never see the button because it is below the fold on mobile. Move it up first.”
Prioritizing Fixes Across Multiple Pages
If you have 50 underperforming pages, which 5 do you fix first? Page-level data answers this:
- Sort pages by traffic (high to low)
- Sort pages by conversion rate (low to high)
- Fix pages with high traffic + low conversion first
Measuring Before/After Impact
Page-level data allows precise measurement:
- Run audit on Page X → record baseline metrics
- Implement fixes → re-run audit
- Compare before vs. after on the same page
This is impossible with site-wide averages because other pages change simultaneously.
For real examples of page-level fixes that increased conversions, read how Page Datalyzer identifies conversion killers.
Tools for Page Level Data Analysis
Several tools offer page-level analysis capabilities:
| Tool | Best For | Page-Level Features |
|---|---|---|
| Page Datalyzer | All-in-one page audits | 50+ friction points, Core Web Vitals, client reports |
| Google Analytics 4 | Traffic trends | Basic page metrics (limited diagnosis) |
| Hotjar | User behavior | Heatmaps, session recordings |
| SEMrush | SEO | Page-level keyword rankings |
| Ahrefs | Backlinks | Page-level link analysis |
Recommendation: Use GA4 for traffic trends. Use Page Datalyzer for diagnosis and fixes. Use Hotjar for visual confirmation.
For pricing and plan details, read Page Datalyzer pricing and plans.
Why SEO Consultant Jin Grey Prioritizes Page-Level Data
SEO consultant Jin Grey regularly uses Page Datalyzer for client page audits, applying her 18+ years of SEO expertise to diagnose conversion killers at the page level.
With over 600 successful website projects under her belt, Jin Grey emphasizes that page-level data separates guesswork from strategy. “Most analytics tools tell you what happened,” she explains. “Page Datalyzer tells you what to change on the page itself.”
Her typical client workflow includes:
- Step 1: Run Page Datalyzer on underperforming pages
- Step 2: Identify the top 3 friction points from the report
- Step 3: Implement page-specific fixes based on data
- Step 4: Re-run Page Datalyzer to measure improvement
For Jin Grey, page level data analysis has become an essential part of her SEO consulting toolkit — because it answers the only question that matters: what do I actually fix?
Common Page-Level Problems and How to Fix Them
| Problem | Page-Level Symptom | Fix |
|---|---|---|
| Slow loading | LCP > 2.5 seconds | Compress images, remove render-blocking JS |
| Broken trust signals | Expired security badges | Update badges, fix mixed content warnings |
| Hidden CTAs | CTA below fold on mobile | Move CTA above fold, increase button size |
| Form abandonment | High exit rate on form page | Reduce form fields, add progress indicators |
| Poor mobile usability | Tap targets under 48px | Increase button size, add spacing |
| Thin content | Low time on page | Add relevant images, expand key sections |
| Missing alt text | Accessibility warnings | Add descriptive alt text to all images |
| Broken links | 404 errors on internal links | Fix or remove broken links |
For a complete audit workflow addressing these issues, read our step-by-step Page Datalyzer audit tutorial.
Frequently Asked Questions (FAQs)
1. What is page level data analysis in simple terms?
Page level data analysis means looking at how each individual page on a website performs, rather than averaging all pages together. It answers questions like “Why is my pricing page converting poorly?” instead of “What is my site-wide conversion rate?”
2. Why is page level data analysis better than site-wide averages?
Site-wide averages hide problems. A site with 90 good pages and 10 bad pages looks fine in aggregate. Page-level analysis reveals the 10 bad pages so they can be fixed.
3. How often should page level data analysis be performed?
For most websites, monthly audits are sufficient. For high-traffic e-commerce sites, weekly audits are recommended. After making significant changes, re-run the audit immediately.
4. Can page level data analysis improve SEO rankings?
Yes. Google evaluates pages individually, not sites as a whole. Fixing page-level Core Web Vitals, content quality, and internal linking improves that specific page’s ranking.
5. Is page level data analysis only for large websites?
No. Small websites benefit even more because every page matters. A 10-page website with one terrible page is losing 10% of its potential.
6. What is the difference between page-level and user-level data?
Page-level data analyzes the page itself (load time, layout, content). User-level data analyzes visitor behavior (clicks, scrolls, form fills). Both are valuable and complementary.
7. Does page level data analysis require coding?
No. Tools like Page Datalyzer provide page-level analysis without any coding. The user simply enters a URL and receives a report.
8. How is page level data analysis different from A/B testing?
A/B testing compares two versions of a page against each other. Page-level analysis diagnoses problems on the current version. Use page-level analysis first to identify what to test.
9. Can page level data analysis identify broken links?
Yes. Most page-level analysis tools check every link on a page and flag 404 errors, redirect chains, and broken anchor text.
10. Does page level data analysis track real-time user behavior?
Some tools do (e.g., Hotjar). Page Datalyzer focuses on technical and structural analysis, which does not require real-time data.
11. How long does a page-level audit take?
Using Page Datalyzer, a single page audit takes 30-60 seconds. A full 50-page audit takes about an hour, most of which is reviewing the report.
12. What is the first metric to look at in a page-level audit?
Start with page-specific conversion rate if the page has a goal (purchase, signup). If not, start with bounce rate and time on page.
13. How many pages should be audited at once?
For the first audit, start with your 10 most important pages (homepage, top product pages, key landing pages). Expand to 50 pages after fixing the initial issues.
14. Can page level data analysis be automated?
Yes. Tools like Page Datalyzer offer APIs for automated recurring audits. This is common for agencies auditing client pages weekly.
15. What is the ROI of page level data analysis?
Typical ROI: fixing one underperforming product page that converts at 0.5% to 2% on an e-commerce site with 10,000 monthly visitors and $50 average order value adds $7,500+ per month in revenue.
16. How does page level data analysis compare to Google Analytics?
Google Analytics shows traffic trends and audience demographics. Page-level analysis shows specific page problems and how to fix them. Use both.
17. Is Page Datalyzer the only tool for page-level analysis?
No. Other tools offer some page-level features, but Page Datalyzer is one of the few focused exclusively on diagnosis and actionable fixes.
18. What is the best free tool for page-level analysis?
Page Datalyzer’s free tier (10 audits/month) is the most comprehensive free option. Google PageSpeed Insights is also useful but only covers speed metrics.
19. Can page level data analysis replace a CRO specialist?
No. Page-level analysis provides data and recommendations. A CRO specialist interprets that data within business context and implements complex fixes.
20. Is page level data analysis GDPR compliant?
Yes. Page Datalyzer stores all audit data on EU servers by default, uses no cookies, and offers DPAs for paid plans — making it GDPR-friendly for international businesses.
Conclusion
What is page level data analysis? It is the practice of examining individual URL performance rather than relying on misleading site-wide averages.
Why does page-level data matter? Because a page converting at 2% and a page at 0.2% look identical in aggregate reports. Without page-level analysis, you will optimize the wrong pages, waste budget, and leave revenue on the table.
How can you start? Use a tool like Page Datalyzer to run your first audit today. Start with your 10 most important pages. Fix the critical issues first. Measure the impact. Then expand to more pages.
As SEO consultant Jin Grey demonstrates in her consulting work, the difference between guessing and knowing comes down to page-level data. Page Datalyzer delivers that clarity.
Ready to stop guessing and start fixing? Explore the Page Datalyzer: Complete Guide to Page-Level Analytics for a complete walkthrough.