
Understanding your profit and loss statement is one of the fastest ways to stop “flying blind” and start running your business like a real CEO. A P&L (also called an income statement) shows you whether your company is actually making money, where that money comes from, and where it’s leaking out.
Instead of seeing it as an accountant-only document, this guide will walk you through what a profit and loss statement is, how it’s structured, how to read it step by step, and how to use it to make better decisions—especially if you’re running lean, using a lean startup model or testing new low-cost business ideas.
Profit and Loss Guide: Why These Statements Matter
Most small business owners live in their bank account: “If there’s money in the account, we’re fine; if not, we panic.” But your bank balance only shows cash in and out—it doesn’t tell you if your business model is truly profitable or just temporarily funded by timing, loans, or personal savings.
A profit and loss statement fixes that by summarizing your revenue, expenses, and profit over a specific period (month, quarter, or year). Guides like “Understanding a Profit and Loss (P&L) Statement” from Bank of America explain that this statement is the core tool lenders, investors, and owners use to evaluate performance. When you understand your P&L, you can see which offers work, which costs are dragging you down, and whether your growth is sustainable.
What Is a Profit and Loss (P&L) Statement?
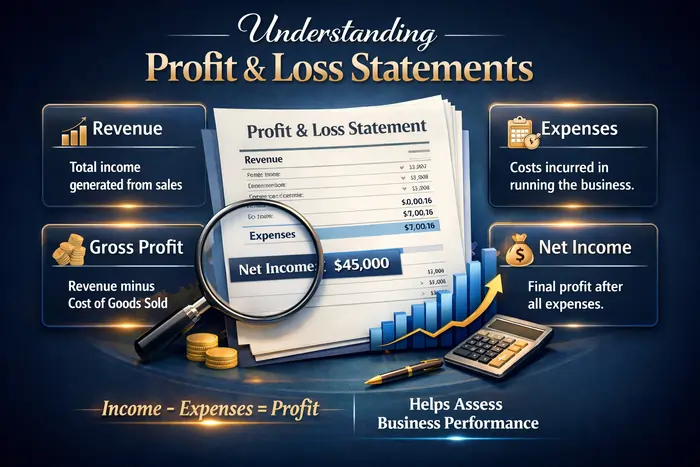
A profit and loss statement (P&L) or income statement shows your business’s revenues and expenses over a period, and the resulting profit or loss. Unlike a balance sheet (which is a snapshot of what you own and owe at a moment in time), a P&L is like a movie showing what happened financially during a month, quarter, or year.
Common names for the same document include:
- Profit and loss statement
- P&L statement
- Income statement
- Statement of earnings or statement of operations
According to Investopedia’s overview of profit and loss statements, every P&L boils down to the same basic formula: revenue minus expenses equals profit (or loss). That simplicity is what makes it so powerful for day-to-day decision making.
Key Components of a Profit and Loss Statement
Most income statements follow a similar top-to-bottom structure, whether you’re a freelancer or a funded startup.
Revenue (Sales)
This is the total amount your business earned from selling products or services in the period—often called “top line.” It may be broken down into:
- Product vs service revenue.
- Recurring vs one-time revenue.
- Different business lines or segments.
Cost of Goods Sold (COGS)
COGS are the direct costs of producing the goods or services you sell (e.g., materials, manufacturing, contractor labor directly tied to delivery). Service businesses sometimes label this “cost of sales.”
Gross Profit and Gross Margin
Gross profit = revenue − COGS.
It shows how much is left after covering direct costs, before overhead. Gross margin expresses that as a percentage of revenue, which is a key metric when comparing products or tracking pricing power over time.
Operating Expenses (OPEX)
Operating expenses are the indirect costs of running your business:
- Rent, utilities, software subscriptions.
- Salaries and benefits (for non-production staff).
- Marketing and advertising.
- General & administrative (G&A) expenses.
These don’t change in direct proportion to each unit sold, but they’re crucial to keep your business running.
Operating Income
Operating income (sometimes called operating profit) is:
It reflects how profitable your core operations are, before financing costs and taxes.
Other Income and Expenses
Below operating income, you’ll often see:
These can distort results for a single period, so it’s important to separate them in your analysis.
Net Income (Bottom Line)
Finally, net income (net profit or net loss) is what’s left after all expenses, including interest and taxes. This is your “bottom line” and one of the most watched numbers by owners, investors, and lenders.
For a visual breakdown of these components with diagrams and simple examples, resources like Corporate Finance Institute’s profit and loss statement guide and Xero’s “What is a Profit & Loss Statement” glossary page are very helpful.
How to Read a Profit and Loss Statement Step by Step
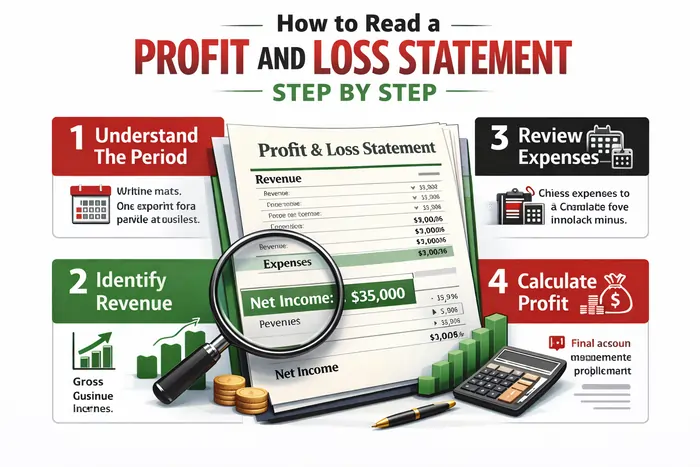
If you’ve never read one before, a P&L can look intimidating. But if you follow the same simple sequence each time, it becomes manageable.
Step 1: Check the Period and Revenue
Start by confirming:
- What period the statement covers (month, quarter, year).
- Total revenue for that period.
Compare that revenue to:
This tells you if sales are growing, flat, or shrinking. Guides like LivePlan’s “How to Read and Understand Your Income Statement” emphasize trend comparison as the first step.
Step 2: Look at COGS and Gross Profit
Next, look at COGS and calculate:
If your gross margin is shrinking (costs rising faster than prices), you may need to:
Step 3: Review Operating Expenses
Scan operating expenses (OPEX) and note:
- Which categories are largest.
- Any big jumps vs prior periods.
Articles like Milestone’s guide on understanding a P&L statement suggest looking at expense ratios—each major cost as a percentage of revenue—to see whether the business is scaling efficiently or just getting more expensive.
Step 4: Compare Operating Income and Net Income
Then compare operating income to net income. If there’s a big drop between them, ask:
- Are interest expenses high (debt-heavy business)?
- Are there large one-time items or write-offs?
- Is tax expense unusually high or low this period?
Understanding these differences helps you separate core performance from temporary noise.
Step 5: Look at Trends, Not Just One Period
Finally, line up several periods in a row (e.g., last 6–12 months) and look for trends:
- Is revenue steadily increasing, or spiking and crashing?
- Are gross margins stable or slipping?
- Are expenses growing in line with revenue, or faster?
Step-by-step tutorials such as Paychex’s article on how to create and read a profit and loss statement and PNC’s “Understanding Profit Loss (P&L) Statements” guide walk through this process using small business examples.
Essential Ratios and Metrics from Your P&L
Once you’re comfortable with the basic layout, you can pull a few simple metrics from your P&L to track over time.
Gross Margin
Gross Margin=RevenueGross Profit
This tells you how much of each dollar of revenue is left after direct costs. Low or falling gross margins can signal pricing issues, rising input costs, or an unprofitable product mix.
Net Profit Margin
Net Profit Margin=RevenueNet Income
This shows how much profit you keep after all expenses, including interest and taxes. It’s a quick way to benchmark your overall profitability against competitors or industry averages.
Revenue Growth Rate
Growth Rate=RevenuepriorRevenuecurrent−Revenueprior
Tracking this monthly or quarterly helps you see whether your sales strategies are working.
Expense Ratios
You can also track each major expense category as a percentage of revenue, such as:
This makes it easier to decide where to cut or invest more. For a more detailed look at P&L analysis, the article “P&L Analysis for Small Business Owners” by Paro is a strong reference.
Using Your P&L to Run the Business (Not Just for Tax)
Too many founders only look at their P&L at tax time. The businesses that feel “well steered” treat it as a monthly dashboard.
You can use your P&L to:
- Track performance: Are new marketing campaigns actually increasing revenue and profit, or just costs?
- Spot problems early: Rising COGS, shrinking margins, or a spike in overhead can be caught before they become crises.
- Support funding conversations: Lenders and investors often ask for P&L statements as part of their review.
If you’re running your company with a lean startup model, your P&L becomes evidence of which experiments work and which to kill. Our guide to the Lean Startup Model shows how to tie build–measure–learn loops directly to financial outcomes, so every pivot is grounded in data, not just gut feel.
Likewise, when you’re choosing from several low-cost business ideas, understanding how each might shape a P&L (different margins, different fixed costs) helps you select concepts with a higher chance of sustainable profit. You can explore practical options in our low-cost business ideas roundup.
For an overview of P&L management as an ongoing discipline, guides like Wise’s profit and loss management explainer and Rho’s finance guide to P&L management break down how finance teams use this statement to steer the business.
Common Mistakes When Reading Profit and Loss Statements
Even seasoned owners make predictable mistakes with P&Ls. Knowing them helps you avoid bad decisions.
- Confusing profit with cash: A profitable P&L doesn’t guarantee you have cash in the bank—timing differences, loan repayments, and capital expenditures show up elsewhere, especially on the cash flow statement.
- Ignoring non-operating items: One-off gains (like selling equipment) can make a bad month look good, while one-time write-offs can make a healthy business look worse. You need to separate recurring operations from noise.
- Looking at one period in isolation: A single month can be noisy; trends over multiple periods show the real story.
- Not digging into line items: Big categories like “Miscellaneous expense” can hide important details; it’s worth asking your bookkeeper or accountant to break things out more clearly.
Articles like “How To Understand a Profit & Loss (P&L) Statement” by Milestone and PNC’s P&L guide highlight these pitfalls with real examples.
Walking Through a Sample P&L
Imagine a small online service business with this monthly P&L:
- Revenue: 10,000
- COGS (contractors, direct software): 3,000
- Gross profit: 7,000
- Operating expenses (rent, tools, marketing, admin): 5,000
- Operating income: 2,000
- Interest and taxes: 500
- Net income: 1,500
From this, you can quickly see:
- Gross margin = 7,000 ÷ 10,000 = 70% (healthy for many service businesses).
- Net profit margin = 1,500 ÷ 10,000 = 15%.
- Operating expenses are 50% of revenue (5,000 ÷ 10,000).
If, next month, revenue stays at 10,000 but operating expenses climb to 7,000, net income will drop sharply—your P&L will show that you have a cost problem, not a sales problem.
For more sample statements and templates, you can look at resources like Small Business Development Corporation’s example profit and loss statement or the examples inside Paychex’s P&L guide.
How the P&L Connects to Balance Sheet and Cash Flow
Your profit and loss statement doesn’t live alone. Together with the balance sheet and cash flow statement, it gives a full picture of your business.
- The P&L shows performance over time (profitability).
- The balance sheet shows what you own and owe at a point in time.
- The cash flow statement shows actual cash in and out.
The U.S. Securities and Exchange Commission’s Beginner’s Guide to Financial Statements and Corporate Finance Institute’s income statement and financial statement resources explain how these three statements connect.
You can be profitable on your P&L but still run out of cash if:
- Customers pay very late.
- You’ve taken on heavy loan repayments.
- You’re investing aggressively in equipment or inventory.
That’s why understanding all three statements is part of thinking like a real entrepreneur, not just a technician.
Understanding your profit and loss statement isn’t about becoming a full-time accountant; it’s about giving yourself the tools to make smarter decisions. When you can read your P&L, choose and test low-cost business ideas with clear financial expectations, and use lean experiments—like those in our Lean Startup Model and low-cost business ideas guides—you shift from guessing to managing. Over time, that shift is what turns a side hustle into a real, resilient business.